


Walls of text
The answer is good, but it is a wall of paragraphs. Nobody finishes it, so the point never lands.
Paste an article, an AI chat or your notes. Infograph turns it into a visual story people actually finish, with every number taken from what you gave it.
Free plan · No card needed · Your stories stay private until you share them
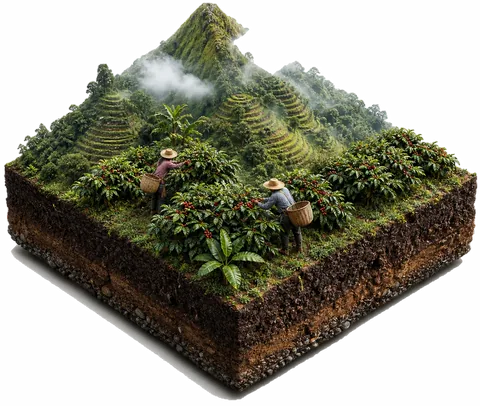
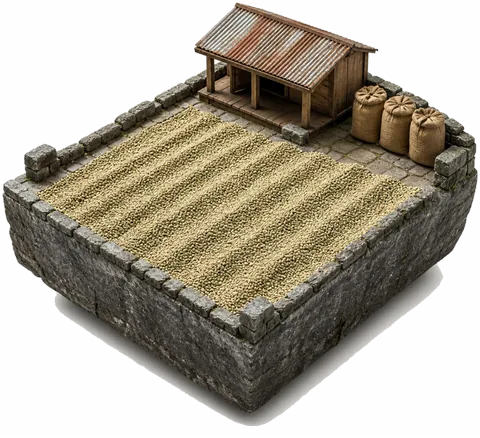
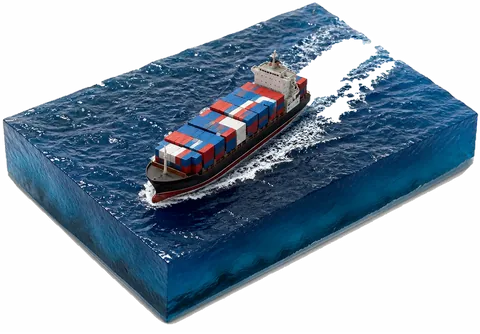



The answer is good, but it is a wall of paragraphs. Nobody finishes it, so the point never lands.
The one answer you need sits under forty messages. You will ask again next week instead of finding it.
Turning it into a slide or graphic means a designer, a template and an afternoon you did not plan for.
Paste any text, or capture a web page or AI chat in one click with the Chrome extension.
Infograph finds the story inside: the steps, the numbers, the trade-offs. Then it picks the right shape for each part.
Send a link or embed it on your site. It scrolls like a story, made to be read to the end.
Anyone can make a chart look good. The hard part is keeping the story true to what you gave it.
Every figure has to appear in the text you captured. If a number is not in the source, Infograph removes it before the story reaches you, and each story keeps its source attached so you can check it.
Each story gets its own scene: a farm, a roaster, a cup. Real objects in their real colours, never clip art.
A process gets a route. A comparison gets two sides. A ranking gets bars that move. Infograph picks the block that fits each part.
Share with a link or embed on your site. Revoke any link and new readers can no longer open it.
Nothing is public until you share it. No ad tracking, no cross-site tracking, and we do not sell captured data.
Five templates, one story: the life of a latte. Each runs live on this page with its own scroll and its own objects. Pick one and scroll inside it.
Scroll inside the story
Steps, in order
Time you can feel
Where it all goes
Two sides, fairly
Numbers that land
Rankings that move
Places, pinned
What it's made of
Counts you can see
Words that matter
As carousel, images or PDF
Write in 26 languages
| Infograph | Slide deck | AI image | |
|---|---|---|---|
| Numbers traced to your source | Yes, or they are removed | Only if you check each one | Can invent figures |
| Built from a pasted answer | Straight from the text you paste | Layout by hand | Retry until it looks right |
| Scrolls like a story | Yes | No, page by page | No, one static image |
| Embed on your website | Yes | Export a file | Export a file |
| Revoke a link you shared | Yes | Not possible | Not possible |
Comparison is for a typical slide deck and a typical AI image tool, not any one product.
Turn a chapter into a story the whole class remembers.
Turn your research into posts people read to the end.
Turn how your product works into something anyone gets.
Turn data and reports into stories people pass on.
$0to start, no card
For trying it on everything you read.
Early access
For people who explain things every week.
Pro is currently arranged by email. Before you pay, we confirm the price, currency, billing period, included limits and access start date in writing. Refunds and cancellation · Contact us about Pro.
Yes. The free plan gives you new stories and realistic objects every day, and you don't need a card to start.
Anything with words: an article, an AI chat answer, research notes, a report or the page you're reading. Paste it in, or capture it with the Chrome extension.
No number reaches your story unless it is in your source. Infograph removes any figure the source does not contain, and every story keeps its source attached so you can check each part before you share it.
Yes. Change the wording, reorder the blocks or pick a new palette. Nothing is public until you share it.
Yes. Every story gets a share link and an embed code. The embed scrolls just like the full story.
Only you, until you share one. Anyone with a link can read a shared story, and you can revoke that link at any time so new readers cannot open it.
It goes to the AI providers that build your story. We do not sell it, add ad tracking or use it for advertising. The privacy policy lists the providers and how long data is kept.
Yes. You can build and read stories in the browser on a phone, and shared stories scroll well on any screen.
No. Infograph picks the shape for each part. Pick a palette if you want a different feel, and edit any block you like.
No card needed. Read the privacy policy before you sign up.
